







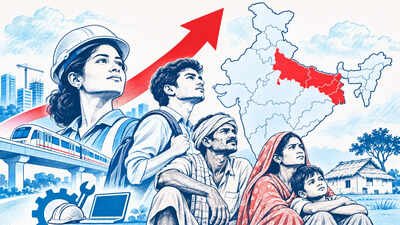
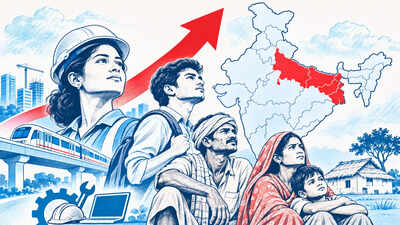
India’s sharp decline in extreme poverty has given the government much to celebrate. Prime Minister Narendra Modi hailed the World Bank’s latest findings as “A historic fall in poverty. A generational rise in opportunity.” He has linked the reduction in poverty to economic growth, infrastructure investment, welfare schemes and employment opportunities.The improvements are tangible. In 2011–12, roughly 27 out of every 100 Indians lived below the international extreme-poverty line of $3 a day. By 2023–24, fewer than three did. That is one of the fastest declines in poverty anywhere in the world. Yet the numbers reveal another, less discussed reality. About 57% of India’s poor live in a contiguous belt stretching from Uttar Pradesh to West Bengal, according to the World Bank’s October 2026 Poverty & Equity Brief.Globally, progress against extreme poverty has largely stalled. An estimated 81.1 crore people, or one in ten worldwide, live below $3 a day in 2026, virtually the same share as in 2019. Nearly 370 crore people, almost half the world’s population, live below the higher $8.30-a-day line. Slower growth, conflict and too few productive jobs have made further progress difficult.
Poverty falls sharply: But the struggle is far from over
By comparison, India has made rapid progress. But the poverty that remains is concentrated in particular regions, and among households with fewer assets, less education and little access to stable, well-paying work. Further progress will increasingly depend on whether the states where poverty is concentrated can create better jobs and opportunities.
The millions caught between poverty lines
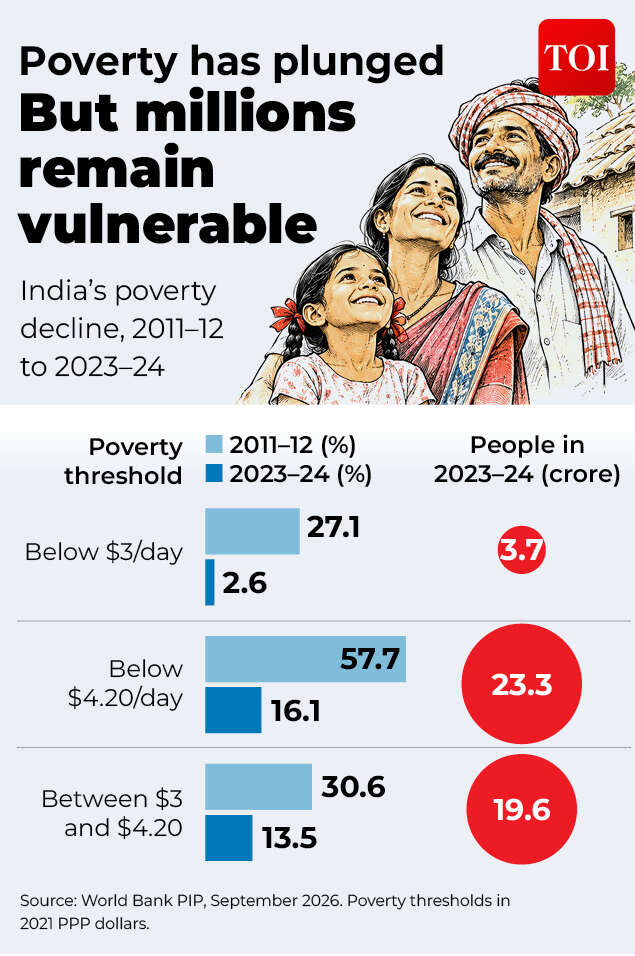
Extreme poverty, measured at $3 per person per day, fell from 27.1% in 2011–12 to 2.6% in 2023–24. At the higher $4.20-a-day line, which the World Bank uses for lower-middle-income countries such as India, poverty fell from 57.7% to 16.1%. The Bank estimates that the number of people below this line dropped by 49.6 crore over the period. Both lines are international consumption benchmarks, set in 2021 purchasing-power-parity (PPP) dollars, which adjust for what money buys in each country.In 2023–24, about 3.7 crore Indians were below the extreme-poverty line. About 23.3 crore were living below $4.20 a day. That leaves roughly 19.6 crore Indians above the extreme-poverty threshold but still below the higher line.
Poverty rate and absolute numbers
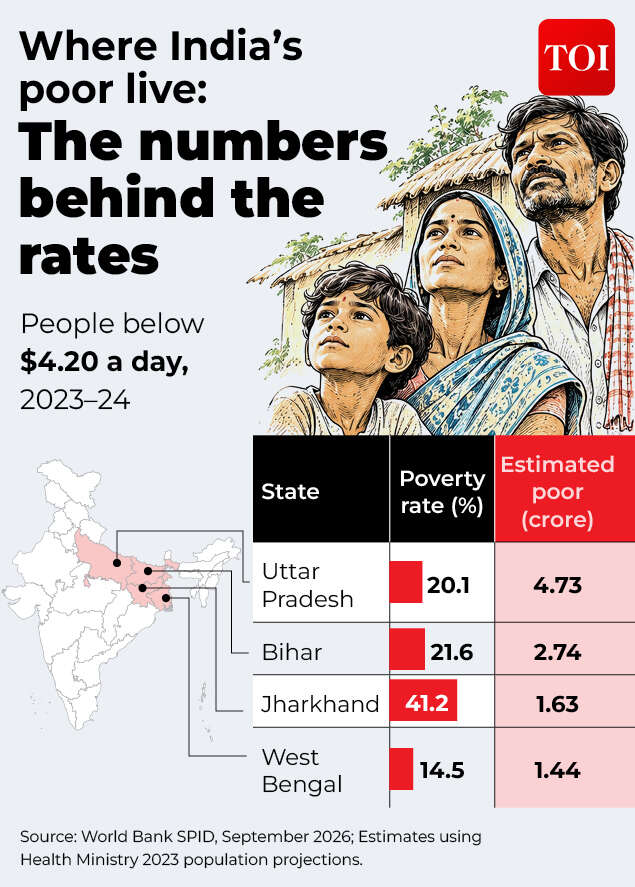
Jharkhand had the highest extreme-poverty rate among Indian states in 2023–24, at about 12.9%, according to the World Bank’s September 2026 Subnational Poverty and Inequality Database. Bihar’s rate was much lower, at 4.1%.In absolute numbers, however, the two states are almost level. TOI combined the World Bank’s state poverty rates with Health Ministry population projections. By that estimate, Bihar had about 51.8 lakh people below the $3 line, and Jharkhand 51 lakh.Uttar Pradesh provides another example. Its extreme-poverty rate was about 2%, but its population is so large that nearly 47 lakh people were still estimated to be below the line. At the higher $4.20 line, Jharkhand’s poverty rate was 41.2%, compared with 21.6% in Bihar, 20.1% in Uttar Pradesh and 14.5% in West Bengal.Yet Uttar Pradesh, at less than half Jharkhand’s rate, had the largest number of people below this line among the four states, about 4.73 crore. Bihar had another 2.74 crore, Jharkhand 1.63 crore and West Bengal 1.44 crore.Together, these four states were home to about 10.54 crore people below $4.20 a day, by TOI’s calculations. That is nearly 47% of the total when the estimates for every state and Union territory are added up. But large numbers of poor people are not confined to the northern and eastern belt.Maharashtra, one of India’s largest state economies, had an estimated 2.34 crore people below $4.20 a day, the third-highest state total after Uttar Pradesh and Bihar. Its poverty rate at this threshold was 18.5%, lower than those of Bihar and Jharkhand, but its large population pushed the absolute number much higher. Even at the $3 extreme-poverty line, Maharashtra had an estimated 40 lakh people below the threshold, the fourth-largest number among states.
The geography of poverty
Other measures show the same divide
India’s own data on multidimensional poverty point the same way. NITI Aayog’s National Multidimensional Poverty Index measures deprivation across health, education and living standards rather than spending alone.Its survey-based findings show that Bihar’s multidimensional poverty rate fell from 51.9% in 2015–16 to 33.8% in 2019–21. Jharkhand’s declined from 42.1% to 28.8%, and Uttar Pradesh’s from 37.7% to 22.9%. Even after these falls, about one in three people in Bihar was still poor on this measure at the time of the survey.In 2023–24, average monthly spending per person in rural Jharkhand was ₹2,946, against a national rural average of ₹4,122, according to the Ministry of Statistics and Programme Implementation’s household consumption survey. That is about 29% lower than the national rural average. The same survey found that people in Jharkhand’s towns and cities spent 83% more on average than those in its villages, the widest urban-rural gap among India’s 18 major states.
More jobs, flat earnings
Employment has been a big driver of India’s fall in poverty. The World Bank estimates that the number of employed people rose by about 13.4 crore between 2017 and 2023, much of it driven by rural women entering work. An extra earner in a household can increase what the family spends and help it move above the poverty line. But the Bank notes that earnings, adjusted for inflation, stayed broadly unchanged, and much of the new employment was in relatively low-productivity work.According to the Periodic Labour Force Survey Annual Report 2025, 56.2% of employed Indians were self-employed, while 23.6% had regular wage or salaried jobs. Agriculture still accounted for 43% of employment. The share of regular salaried workers did rise, from 22.4% in 2024 to 23.6%, while agriculture’s share of employment fell.The government’s 2023–24 consumption survey found that average monthly spending per person was ₹3,652 in rural households dependent on casual farm labour, compared with ₹5,005 in rural households relying on regular salaried jobs outside farming. These figures measure household spending, not individual wages, but they show how much living standards vary with the type of work.
Why moving out of farming may not be enough
Leaving farming does not automatically raise incomes, as Bihar shows. Services make up 58.7% of Bihar’s economic output, measured as gross value added, even though the state’s income per person is relatively low, according to the Union government’s Economic Survey 2025–26. But the survey notes that much of this output comes from low-value activities. By contrast, Karnataka, Maharashtra, Tamil Nadu and Telangana together account for nearly 40% of India’s services output, supported by activities such as information technology, finance and professional services.A worker who leaves the fields for small-scale trading or another low-paying service job has moved into services too. But that does not necessarily bring the jump in earnings that a move into a more productive industry would. These states need jobs that pay better and offer a way up.
Poverty’s effects can last beyond the poverty line
Household spending data also miss some consequences of deprivation, such as poor child nutrition. The latest National Family Health Survey, NFHS-6, conducted in 2023–24, shows that child nutrition has improved substantially across India. The share of children under five who are stunted, or too short for their age, fell nationally from 35.5% in 2019–21 to 29.3%.All four states at the centre of this analysis improved too. Stunting declined from 42.9% to 35.6% in Bihar, from 39.6% to 35% in Jharkhand, from 39.7% to 31.5% in Uttar Pradesh and from 33.8% to 22.4% in West Bengal.But a fall in stunting has not always come with a fall in the share of underweight children.In Jharkhand, the share of children under five who were underweight, or too light for their age, rose from 39.4% to 41.1%, even as stunting declined. In Uttar Pradesh, the underweight share also rose, from 32.1% to 34.5%. Bihar improved on both counts, with the underweight share falling from 41% to 35.7%. So did West Bengal, where it fell from 32.2% to 28.5%.
Why the next phase could be harder
So far, India’s progress against poverty has been driven by rising consumption, more people in work and expanded government assistance, including food subsidies. The people still below the line may be harder to reach. As poverty falls, those who remain poor are increasingly concentrated in households with fewer assets, less education, more dependants and little access to stable employment.A young person growing up in a poorer district may have better chances at an education than their parents had, but no guarantee of a well-paying job nearby. The World Bank expects poverty to keep falling, though more slowly. Its projections suggest that the share of Indians below $4.20 a day will fall from 14.2% in 2026 to 12.1% in 2028.
Share your thoughts in the comments
Be respectful · TOI community guidelines
Living standards have improved across most states, including those in the northern and eastern belt. It is less clear whether growth can create more productive jobs and higher earnings in the places where a large share of poor households still live. Better infrastructure, education and healthcare will help. But households also need to be able to turn those gains into reliable incomes. India has already shown that poverty can fall sharply in just over a decade.The next phase will depend not only on lifting those still in extreme poverty, but also on what happens to the 19.6 crore Indians between the two poverty lines, who are above the lowest threshold but have yet to achieve economic security.