







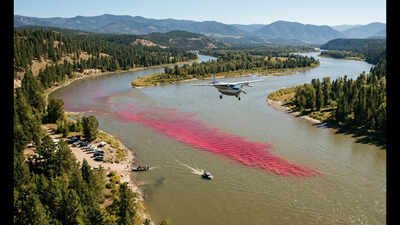
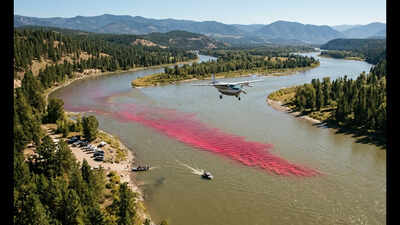
In September 2017, the US Geological Survey (USGS) carried out an unusual experiment on Idaho’s Kootenai River. Researchers released 72.57 kg (160 pounds) of Rhodamine WT dye into the river and then followed its movement through the water. The aim was to understand how a substance spreads as it travels through a flowing river.According to USGS, the dye was released from a single point at the Kootenai Tribal Fish Hatchery on September 26, 2017. The entire release took just 90 seconds. Researchers then had to track what happened to the dye as it moved downstream and spread across the river.They used two methods to follow the plume. Instruments placed in the river measured the dye directly, while an aircraft flew over the Kootenai River the following day, capturing images of the plume from above. Together, the two sets of observations helped researchers study how the dye changed as it moved through the river.The aircraft carried a hyperspectral imaging system, which can record information from different parts of the electromagnetic spectrum rather than taking an ordinary photograph. It flew about 1,000 metres above the ground while making several passes along the river. The images showed the changing plume across the river channel.
Following the dye through the water
The aerial observations were backed by measurements taken directly from the river. Researchers used five water quality sondes to track the Rhodamine WT dye.Four of the instruments were placed at fixed locations in the river. They recorded how the dye concentration changed over time as the plume passed those points. The fifth instrument was placed on a jet boat, allowing researchers to move through the river and measure the dye at different locations.The jet boat measurements were particularly useful because the dye did not simply move in one straight line downstream. Researchers recorded its concentration along the river and across different sections of the channel. This helped them see how the plume changed as it spread through the water.The field measurements continued for nearly 40 hours after the dye was released. During that period, the river flow remained relatively steady. The USGS measured an average discharge of 198.4 cubic metres per second at the gaging station near the Tribal Hatchery. The researchers also recorded the location and time of each measurement.
An aircraft followed the plume from above
On September 27, Quantum Spatial Inc. collected hyperspectral images of the Kootenai River using an ITRES CASI 1500H system mounted on a manned Cessna Caravan aircraft.The aircraft followed shorter flight lines along the river during multiple passes. This allowed researchers to capture the dye plume at different stages of its movement rather than relying on a single image.The system recorded 48 spectral bands between 380 and 1,050 nanometres. The images had pixels measuring 0.5 metres, giving researchers a detailed view of the river surface and the changing plume.The images were then processed so they could be compared with the measurements collected in the river. The data were corrected for atmospheric effects and converted into a form that could be analysed alongside the field observations.This comparison was an important part of the experiment. Researchers wanted to know whether an aircraft could provide useful information about dye concentrations in the river, instead of relying only on instruments placed in the water.
What the experiment was trying to show
The experiment was not simply about photographing a coloured patch moving through the Kootenai River. The researchers were testing whether remote sensing could help measure the concentration of a tracer dye as it spread.The timing of the aircraft flights was recorded so the images could be matched with Rhodamine WT measurements taken from the river at corresponding times. This gave researchers a way to compare what the aircraft saw from above with what instruments measured in the water.The field measurements also had another role. They could be used to support and validate hydrodynamic numerical models that simulate river flow and the movement and dispersion of material through water. The data also supported Lagrangian particle tracking, a method used to study how particles move with flowing water.The USGS published the hyperspectral data from the experiment in 2018. Related research was later published in the Journal of Ecohydraulics in 2019 under the title “Remote sensing of tracer dye concentrations to support dispersion studies in river channels”.